Safe Cities

Index 2015

About the report

The Safe Cities Index 2015 is an Economist Intelligence Unit report, sponsored by NEC. The report is based on an index composed of more than 40 quantitative and qualitative indicators. These indicators are split across four thematic categories: digital security; health security; infrastructure safety; and personal safety. Every city in the Index is scored across these four categories.

Each category, represented throughout the report by the icons shown in the key, comprises between three and eight sub-indicators. These indicators are divided between inputs, such as policy measures and levels of spending, and outputs, such as the frequency of vehicular accidents. A full explanation of the methodology is contained in Appendix 4.

The Index focuses on 50 cities (see box over the page for the full list and regional breakdown) selected by The Economist Intelligence Unit (EIU), based on factors such as regional representation and availability of data. Therefore, it should not be considered a comprehensive list of the world’s safest cities (ie, a city coming number 50 in the list does not make it the most perilous place to live in the world).

The analysis of the Index results, conducted by the EIU, was supplemented with wide-ranging research and in-depth interviews with experts in the field. Our thanks are due to the following people (listed alphabetically by surname) for their time and insights:

  • Alan Brill, senior managing director and founder of the global high-tech investigations practice Krol
  • Jonathan Brown, programme manager of city system integration, Future City Glasgow
  • Vivien Carli, co-author of Practical Approaches to Urban Crime Prevention, International Centre for the Prevention of Crime
  • Tim Chapman, director of the infrastructure design group at Arup
  • Carlos Dora, co-ordinator in the department for public health, environmental and social determinants of health, World Health Organisation
  • Boyd Cohen, director of innovation and associate professor of entrepreneurship, sustainability and smart cities, Universidad del Desarrollo, Chile
  • Bruno Fernandez, head of security, Metro de Madrid
  • Frederick Krimgold, director of the disaster risk reduction programme, Virginia Tech
  • Tom Lawry, director of worldwide health, Microsoft
  • Dan Lewis, head of the urban risk reduction programme, UN Habitat
  • Peggy Liu, chairperson, Joint US-China Collaboration on Clean Energy (JUCCCE)
  • Yoichi Masuzoe, governor of Tokyo
  • Toshiro Muto, CEO of the Tokyo organising committee of the Olympic and Paralympic Games 2020
  • Patrick Otellini, chief resilience officer, the city and county of San Francisco
  • Brian Quinn, adviser, Commission for Architecture and the Built Environment (Cabe) at the UK Design Council
  • Josep Rius, chief of staff to the deputy mayor of Barcelona
  • Andrew Smyth, professor of civil engineering and engineering mechanics, Columbia University
  • Sandra Švaljek, deputy mayor of Zagreb
  • Sameh Naguib Wahba, manager for urban development and disaster risk-management, World Bank.

The report was written by Sarah Murray and edited by James Chambers. Amie Nagano and Takato Mori conducted additional interviews. Chris Clague built the Index. Gaddi Tam was responsible for design. The Economist Intelligence Unit bears sole responsibility for the content of this report. The findings do not necessarily reflect the views of the sponsor.

Executive summary

Cities are already home to a majority of people on the planet. The current level of urbanisation ranges from 82% of the population in North America to 40% in Africa.  But all regions are expected to follow this trend towards greater urbanisation over the next three decades. Lagos, the most populous city Nigeria, is predicted to double in size in the next 15 years.

However, cities should not take continued population growth for granted. As the UN’s latest World Urbanisation Prospects study points out, some cities have experienced population decline because of, among other things, low fertility rates, economic contraction and natural disasters. The population of Seoul, the capital of South Korea, has shrunk by 800,000 since 1990.

Likewise, the safety of cities can ebb and flow. New York recorded a record high of 2,245 homicides in 1990, equating to six murders per day. Since then the population has grown by over 1m people, while homicide rates have fallen. The murder rate in 2013 stood at 335, a historic low, moving New York below Chicago—a city with under one-third of New York’s population.

As some threats recede, others mature. The frequency of terrorism and natural disasters has changed the nature of urban safety: power, communications and transport systems must be robust and able to withstand new external shocks. Meanwhile, new risks emerge. Cyber risk has accompanied the advent of the digital age.

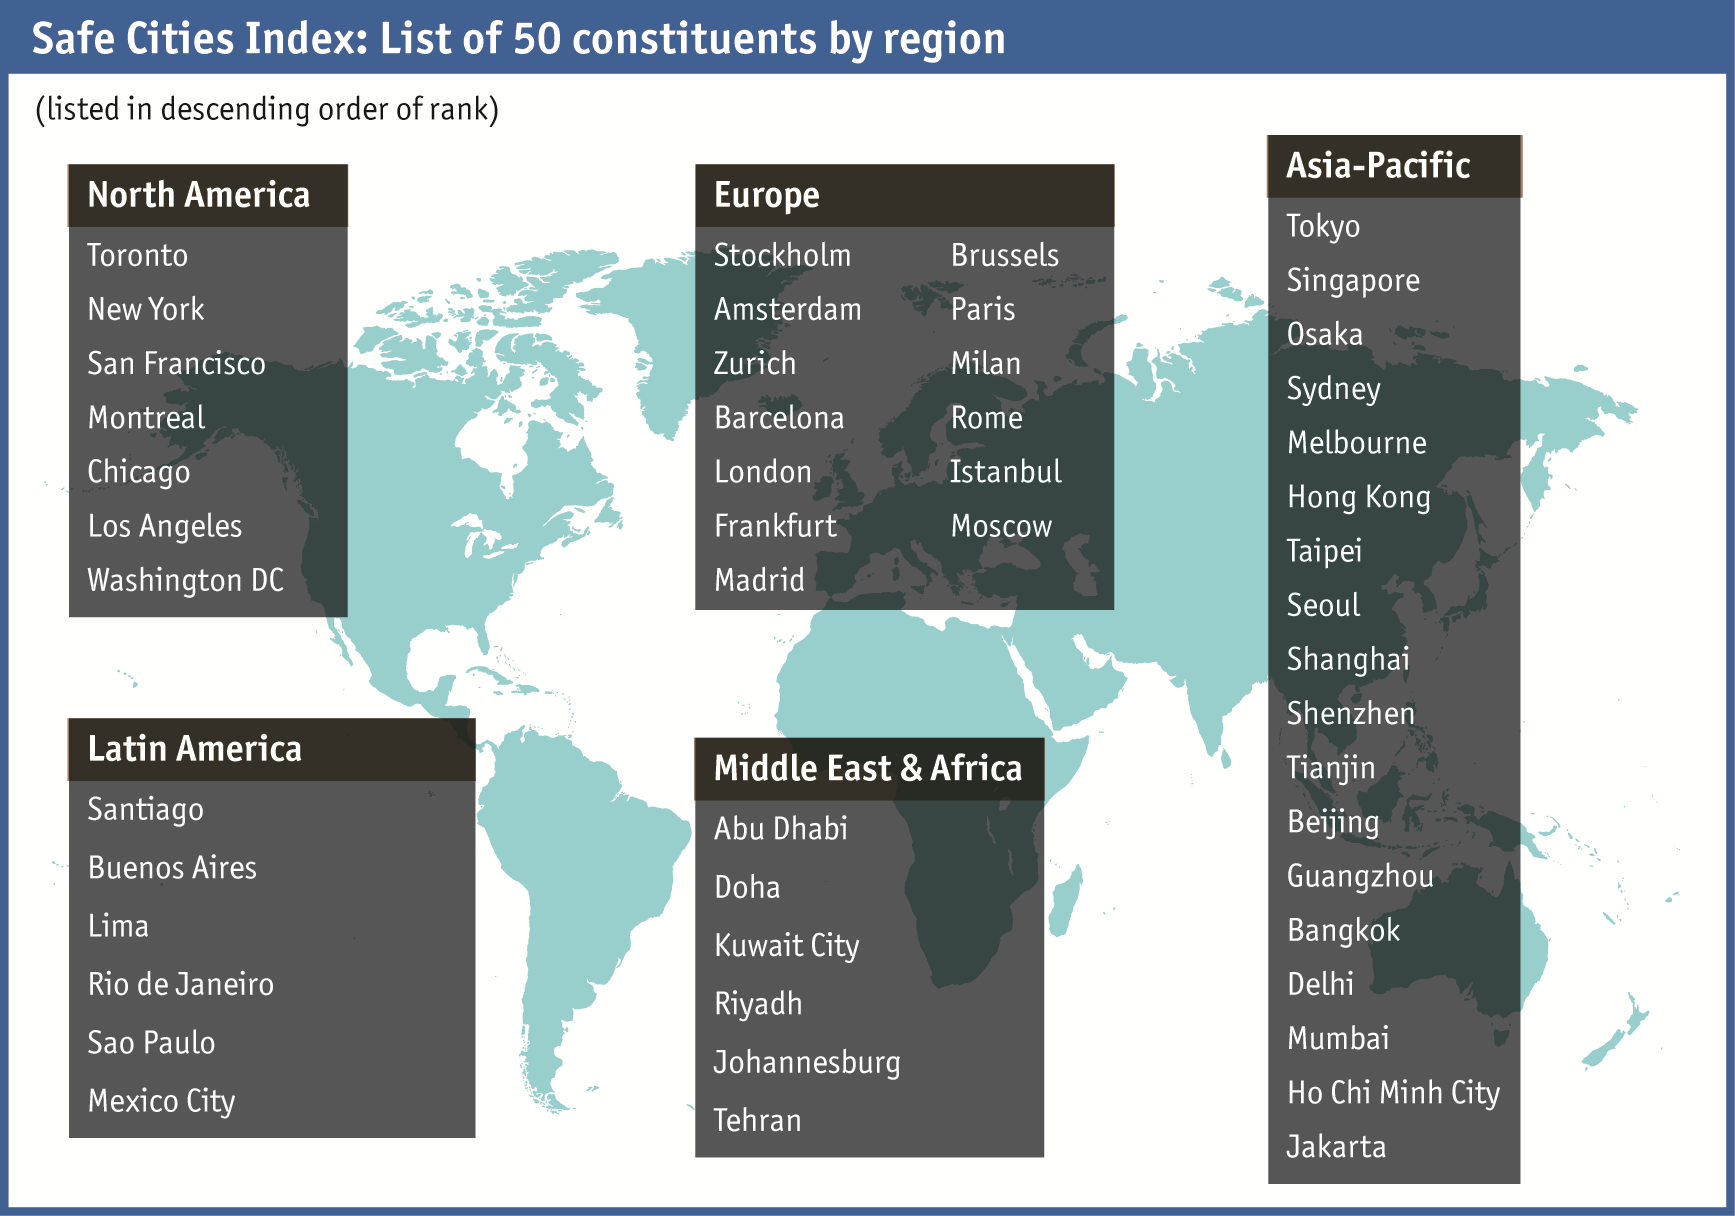
Urban safety is therefore a critical issue that is set to become even more important over time.  Securing public safety means addressing a wide—and evolving—range of risks. The Safe Cities Index aims to capture this complexity. The Index tracks the relative safety of a city across four categories: digital security, health security, infrastructure safety and personal safety. The Index’s key findings include the following.

  • Tokyo tops the overall ranking. The world’s most populous city is also the safest in the Index. The Japanese capital performs most strongly in the digital security category, three points ahead of Singapore in second place. Meanwhile, Jakarta is at the bottom of the list of 50 cities in the Index. The Indonesian capital only rises out of the bottom five places in the health security category (44).
  • Safety is closely linked to wealth and economic development. Unsurprisingly, a division emerges in the Index between cities in developed markets, which tend to fall into the top half of the overall list, and cities in developing markets, which appear in the bottom half.  Significant gaps in safety exist along these lines within regions. Rich Asian cities (Tokyo, Singapore and Osaka) occupy the top three positions in the Index, while poorer neighbours (Ho Chi Minh City and Jakarta) fill two of the bottom three positions.
  • However, wealth and ample resources are no guarantee of urban safety. Four of the five Middle Eastern cities in the Index are considered high-income, but only one makes it into the top half of the Index: at 25 Abu Dhabi is 21 places above Riyadh at number 46. Similar divides between cities of comparable economic status exist elsewhere.  Seoul is 23 positions below Tokyo in the overall ranking (and 46 places separate the two on digital security).
  • US cities perform most strongly in the digital security category, while Europe struggles. New York is the only US city to make it into the top ten of the overall index (at 10). However, it is third for digital security, with three of the four other US cities in the Index (Los Angeles, San Francisco and Chicago) joining it in the top ten. Meanwhile, European cities perform relatively poorly.  London, at 16, is the highest-ranking European entry in the digital security index; Rome is the lowest, at 35.
  • Leaders in digital security must not overlook real-world risks. Los Angeles falls from 6th place in digital security to 23rd for personal safety. San Francisco suffers a similar drop, falling from 8th to 21st.  For these cities—both home to high-tech industries—a focus on technology and cyber security does not seem to be matched by success in combating physical crime. Urban safety initiatives need to straddle the digital and physical realms as the divide between them blurs.
  • Technology is now on the frontline of urban safety, alongside people. Data are being used to tackle crime, monitor infrastructure and limit the spread of disease. As some cities pursue smarter methods of preventing—rather than simply reacting to—these diverse security threats, a lack of data in emerging markets could exacerbate the urban safety divide between rich and poor. Nonetheless, investment in traditional safety methods, such as bolstering police visibility, continues to deliver positive results from Spain to South Africa.
  • Collaboration on safety is critical in a complex urban environment. Now that a growing number of essential systems are interconnected, city experts stress the need to bring together representatives from government, business and the community before threats to safety and security strike. Some cities have appointed an official to co-ordinate this citywide resilience. With the evolution of online threats transcending geographical boundaries, such co-ordination will increasingly be called for between cities.
  • Being statistically safe is not the same as feeling safe. Out of the 50 cities, only Zurich and Mexico City get the same rank in the overall index as they do in the indicator that measures the perception of safety among their citizens. Urban citizens in the US, for instance, tend to feel less safe than they should, based on their city’s position in the Index. The challenge for city leaders is to translate progress on safety into changing public perceptions. But cities also aspire to be attractive places to live in. So smart solutions, such as intelligent lighting, should be pursued over ubiquitous cameras or gated communities.

Introduction

SimCity was one of the first computer games to achieve mass popularity. First released in 1989, game players are given tax revenue with which to plan and build an urban environment. The city only develops if the player meets certain conditions, such as providing essential healthcare services and establishing sufficient energy supplies. From time to time disasters such as earthquakes sweep across the city, forcing players to rebuild.

As SimCity demonstrates, managing cities can be extremely complex. Get it wrong and your city becomes an unhealthy, crime-infested place in which citizens feel physically and emotionally insecure. Get it right and you can attract global executives, affluent tourists, creative minds and entrepreneurial adventurers—all of whom contribute to a city’s economic, social and cultural dynamism.


“When you think about smart cities, they have the potential of attracting the interest of smart hackers”
-Alan Brill, senior managing director, Kroll


Since the game’s launch a quarter of a century ago, the safety challenges for genuine city planners and leaders have only increased. Rapid urbanisation is swelling city populations (see chart on page 7), straining existing infrastructure and adding to the human cost of accidents and disasters. Increased global mobility hastens the spread of disease in densely populated cities. Demographic ageing requires alterations to the built environment. Severe weather and rising sea levels, meanwhile, expose cities to flooding and tsunamis.

Building greater resilience into urban infrastructure has therefore become increasingly urgent. But cities are also facing entirely new safety challenges. The concept of the “smart city” is revolutionising the way in which everything—from transport systems to water and energy—is managed and delivered. At the same time, a growing dependence on digital technology to deliver everyday services brings with it new vulnerabilities.

Malicious programmers can bring about large-scale disruption of computer networks on which a city depends. (The main character of Watch Dogs, a computer game released in 2014, is a vigilante who can hack into Chicago’s computer network to cause chaos.) Ordinary citizens, meanwhile, face new urban threats in the form of Internet fraud and identity theft. “When you think about smart cities, they have the potential of attracting the interest of smart hackers,” says Alan Brill, senior managing director at Kroll and founder of the consultancy’s global high-tech investigations practice.

Against this altered landscape, The Economist Intelligence Unit (EIU) has undertaken a study designed to assess the safety of 50 cities around the world. The Safe Cities Index examines four categories of city safety and security: digital security, health security, infrastructure safety and personal safety. Separate chapters investigate each of these categories individually—although these should not be viewed as mutually exclusive. At some stage every city will need to develop a comprehensive and inclusive approach to urban safety.

Download PDF Download workbook

Urban Safety Benchmarking Tool

VS

1

2

3

4

5

6

7

8

9

10

11

12

Fill in the form to use the Urban Benchmarking Tool

This privacy notice aims to give you information on how NEC Corporation collects and processes your personal data when you download or use the following contents. - Safe Cities Index white paper - Safe Cities Index data book - Safe Cities Index city comparison tool 1. Controller of the Personal Data (1) Company name : NEC Corporation (hereinafter referred to as "NEC") (2) Contact details : General Manager, Integrated Marketing Communication Division, NEC Corporation to [email protected]  (3) Postal address : 7-1, Shiba 5-chome, Minato-ku, Tokyo Japan 108-8001 2. Categories of the Personal Data Personal data includes name, e-mail address, company name and a result of city comparison tool if you use. 3. Purposes of Processing for the Personal Data (1) To respond to inquiries. (2) To respond to requests (3) To introduce or relay information about companies (NEC Group Companies) that deal with NEC products, services, and solutions. (4) To provide information or publicity materials about NEC products, services, and solutions. (5) To provide information about events such as seminars and exhibitions. (6) To contact customers. 4. Recipients of the Personal Data NEC, NEC Group companies, their distributors and agents, NEC affiliates throughout the world, and companies that operate and manage NEC's inquiry site in Japan, upon the assurance that sufficient safety control measures have been established, which have concluded agreements concerning the processing of personal data, to provide services to their customers, within the scope of the stated purposes for using personal data. 5. Overseas Transfer of the Personal Data Economist Intelligence Unit manages and operates this website. (1) Information transfer to a third country: Upon receipt of your inquiry, your personal data will be sent to Hong Kong & Japan. (2) Question of adequate protection: The European Commission has recognized Japan as providing adequate protection of personal data. 6. Period for Which the Personal Data Will Be Stored Personal data may be stored for as long as necessary to achieve the stated purpose for using it. 7. Rights of the Data Subject Under certain circumstances, you have the right with regard to the personal data which you provide as follows: - The right to request from the controller access to and rectification or erasure of personal data or restriction of processing concerning the data subject - The right to object to processing concerning the data subject - The right to data portability: The right to receive the personal data, which the data subject has provided to a data controller, in a structured, commonly used and machine-readable format, and to transmit those data to another data controller without hindrance from the controller to which the personal data have been provided (NEC) - The right to withdraw consent at any time, without affecting the lawfulness of processing based on consent before its withdrawal - The right to lodge a complaint with a supervisory authority, if it exists, in the country or region that the data object belongs 8. Statutory or Contractual Requirement Concerning the Provision of the Personal Data Provision of the personal data is not a statutory or contractual requirement, or a requirement necessary to enter into a contract, and you are not obliged to provide personal data. However, if you choose not to provide personal data, it may not be possible to respond to some inquiries. 9. Non-existence of Decision-making Based Solely on Automated Processing The access log for this website undergoes analysis, however, we do not make decisions that might affect you based solely on automated processing of the personal data that you provide, including profiling, in order to analyze or predict your likes and dislikes or personal behavior. 10. Parental Consent If you are under the age of 18, please make your participation in the survey ONLY AFTER obtaining consent given or authorized by the holder of parental responsibility over you. 11. Encrypted Communication The survey form on this page uses encrypted communication via Secure Socket Layer (SSL) for personal data protection. 12. Security of Processing the Personal Data Recipients of the personal data implement appropriate technical and organisational measures to ensure a level of security appropriate to the risk.

Select Cities to Compare

You can benchmark your city to any of the 60 cities in the index by answering 12 questions about safety. Your answers will be compared to the selected city and will allow you to get an idea of how the cities compare.

Answer the questions about

Does the city have a smart city plan that explicitly focuses on the cybersecurity of the smart city?

Answer the questions about

What percentage of the city’s population has access to the internet?

%

Answer the questions about

How many doctors (per 1,000 population) does the city have?

Answer the questions about

What is the average life expectancy of the population in the city?

Answer the questions about

What is the covid-19 mortality rate (per 100,000 population) in the city?

Answer the questions about

Does the city have a disaster emergency management / city business continuity plan in place and, if so, how adaptive and effective is it?

Answer the questions about

Is disaster risk included and accounted for in active state- or city-level urban planning and design?

Answer the questions about

What percentage of GDP is spent on social assistance programs?

%

Answer the questions about

How prevalent is violent crime in the city?

Answer the questions about

Does the city masterplan outline specific measures for sustainable growth of the urban centre?

Answer the questions about

What is the average annual concentration of PM 2.5 in µg/m3?

Answer the questions about

What is the percentage of tree cover within the city?

%

Calculating Scores...

0%

Urban Safety Benchmarking Tool

Comparison Results

0

out of 24 (full score)

LOWER THAN BENCHMARK CITY

CRITERIA

Does the city have a smart city plan that explicitly focuses on the cybersecurity of the smart city

What percentage of the city’s population has access to the internet

How many doctors (per 1,000 population) does the city have

What is the average life expectancy of the population in the city

What is the covid-19 mortality rate (per 100,000 population) in the city

Does the city have a disaster emergency management / city business continuity plan in place and, if so, how adaptive and effective is it

Is disaster risk included and accounted for in active state- or city-level urban planning and design

What percentage of GDP is spent on social assistance programs

How prevalent is violent crime in the city

Does the city masterplan outline specific measures for sustainable growth of the urban centre

What is the average annual concentration of PM 2.5 in µg/m3

7

What is the percentage of tree cover within the city

Fill in the form to
download the file

NEC Safer Cities Report

Population growth and urbanisation promote development and create value, but also bring about new risks. Learn how NEC is creating cities that are safe, secure, fair and efficient.

FIND OUT MORE
NEC Safer Cities

NEC’s technology solutions for creating safer cities cover the key areas of public safety, smart transportation, digital government, city management and digital health care.

FIND OUT MORE
NEC insights

Read news and case studies about how NEC technology is helping to build smarter, safer cities and intelligent business solutions that solve industrial and social challenges.

FIND OUT MORE